Understanding Results
When navigating to the results page you will be presented with a view that looks like this:
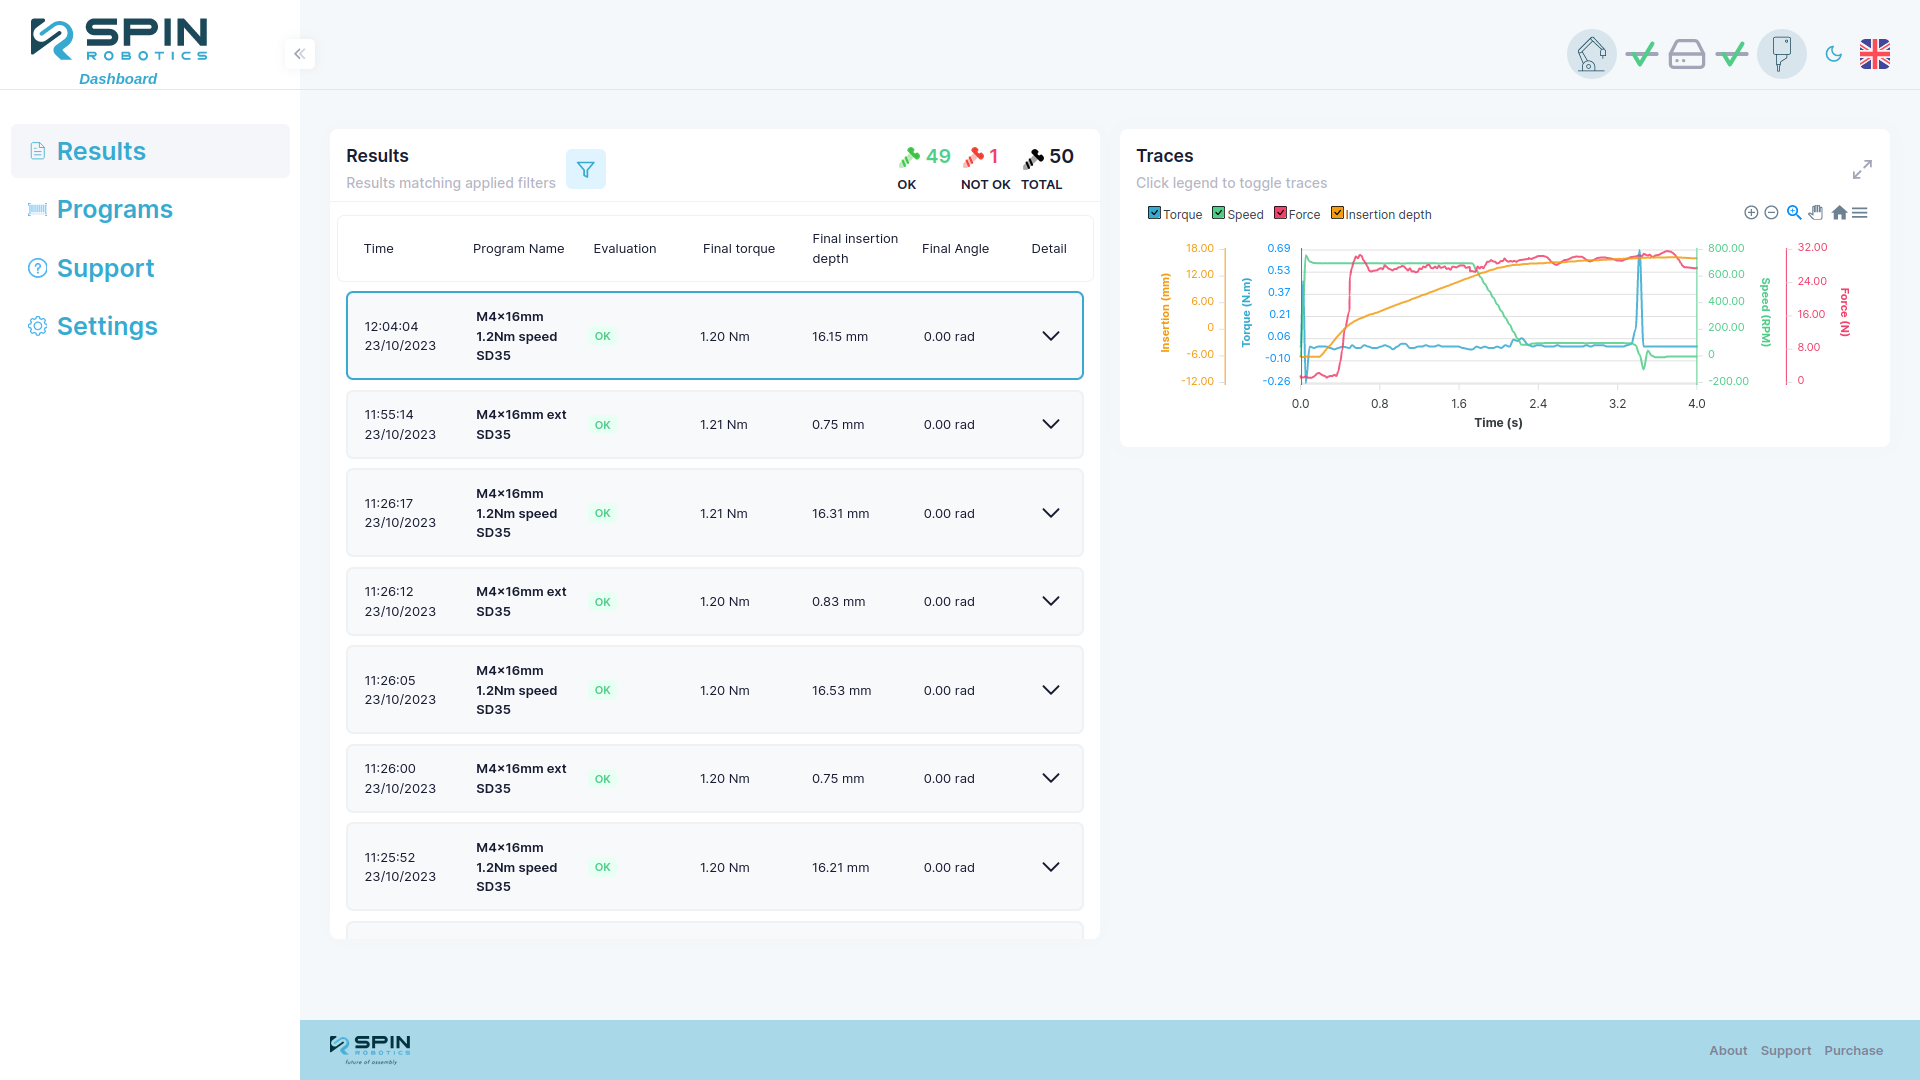
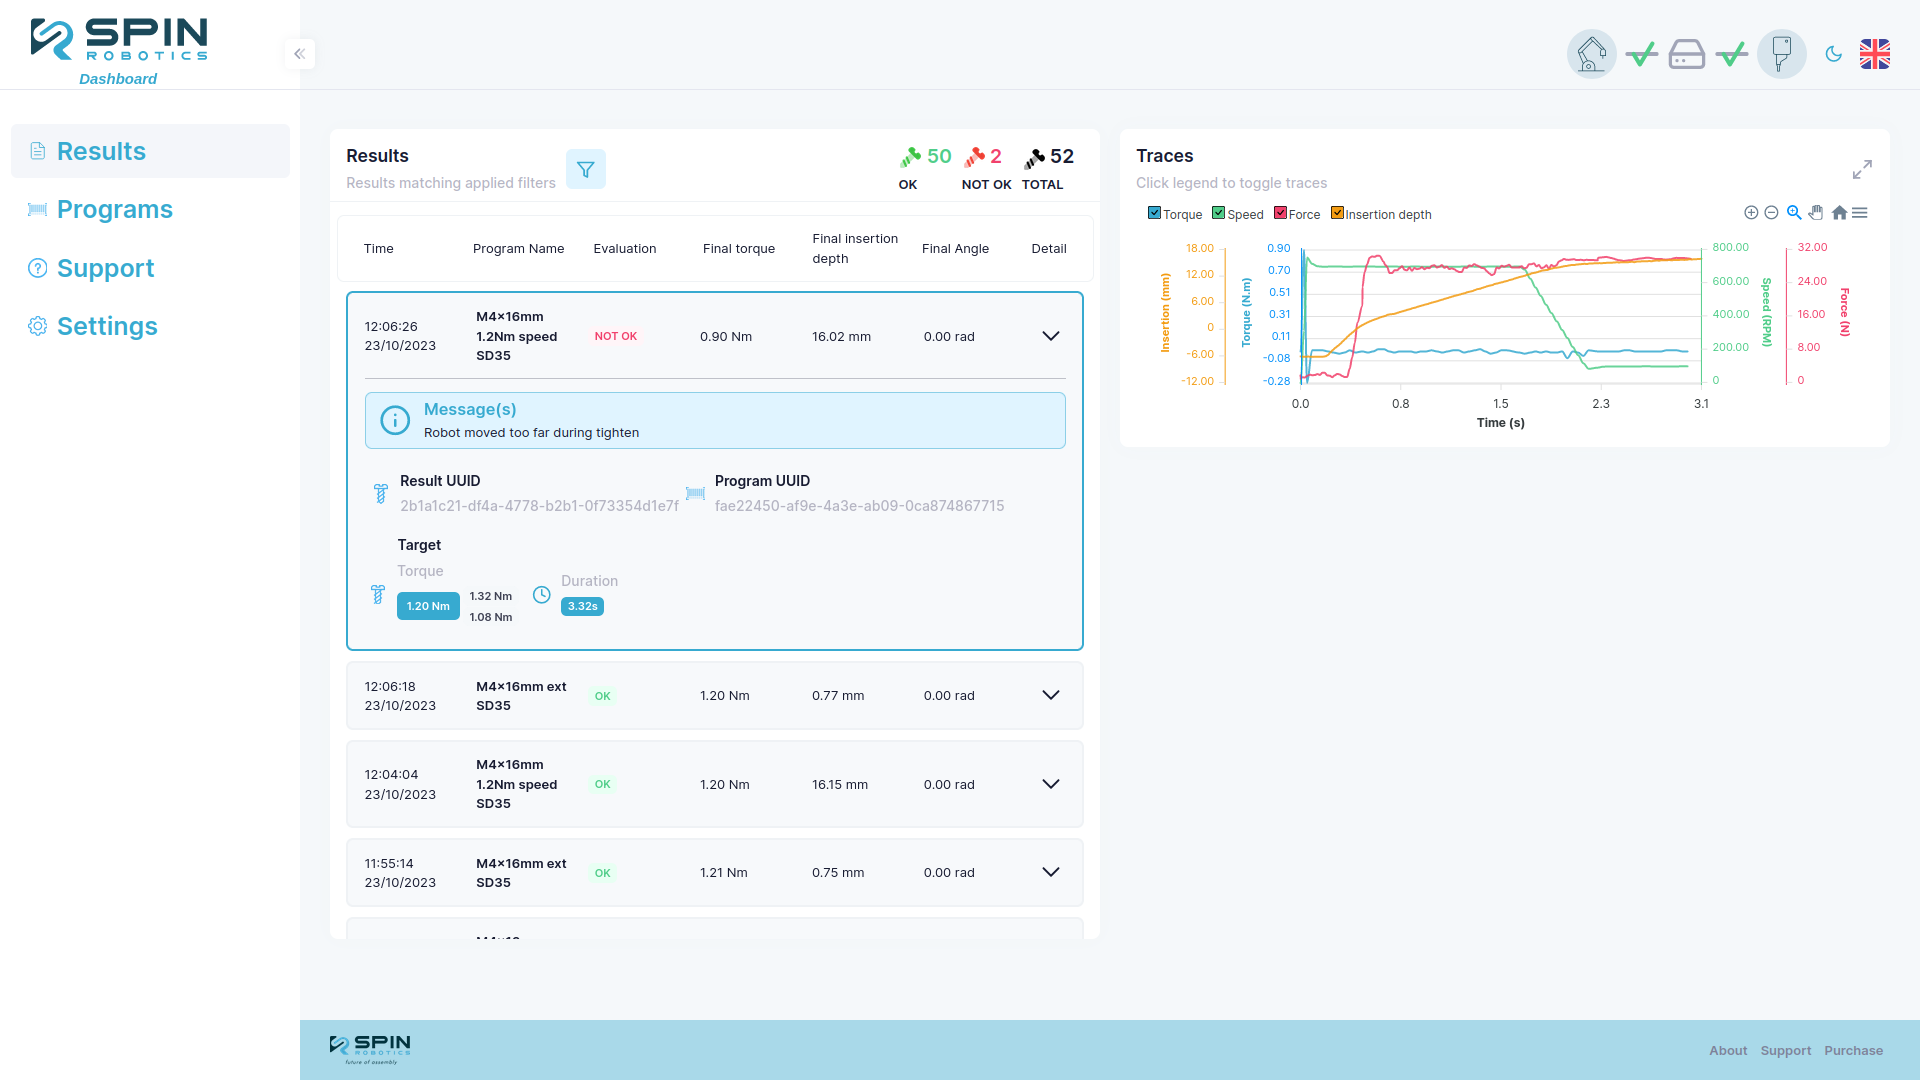
When a result is selected you can see the data traces on the right side of the view by default the latest result is selected. If you click the dropdown arrow you can see aditional information about the result, like the uuid of the result and the program that was used to achive the result. You can also see any messages, like errors that occured during the program run.
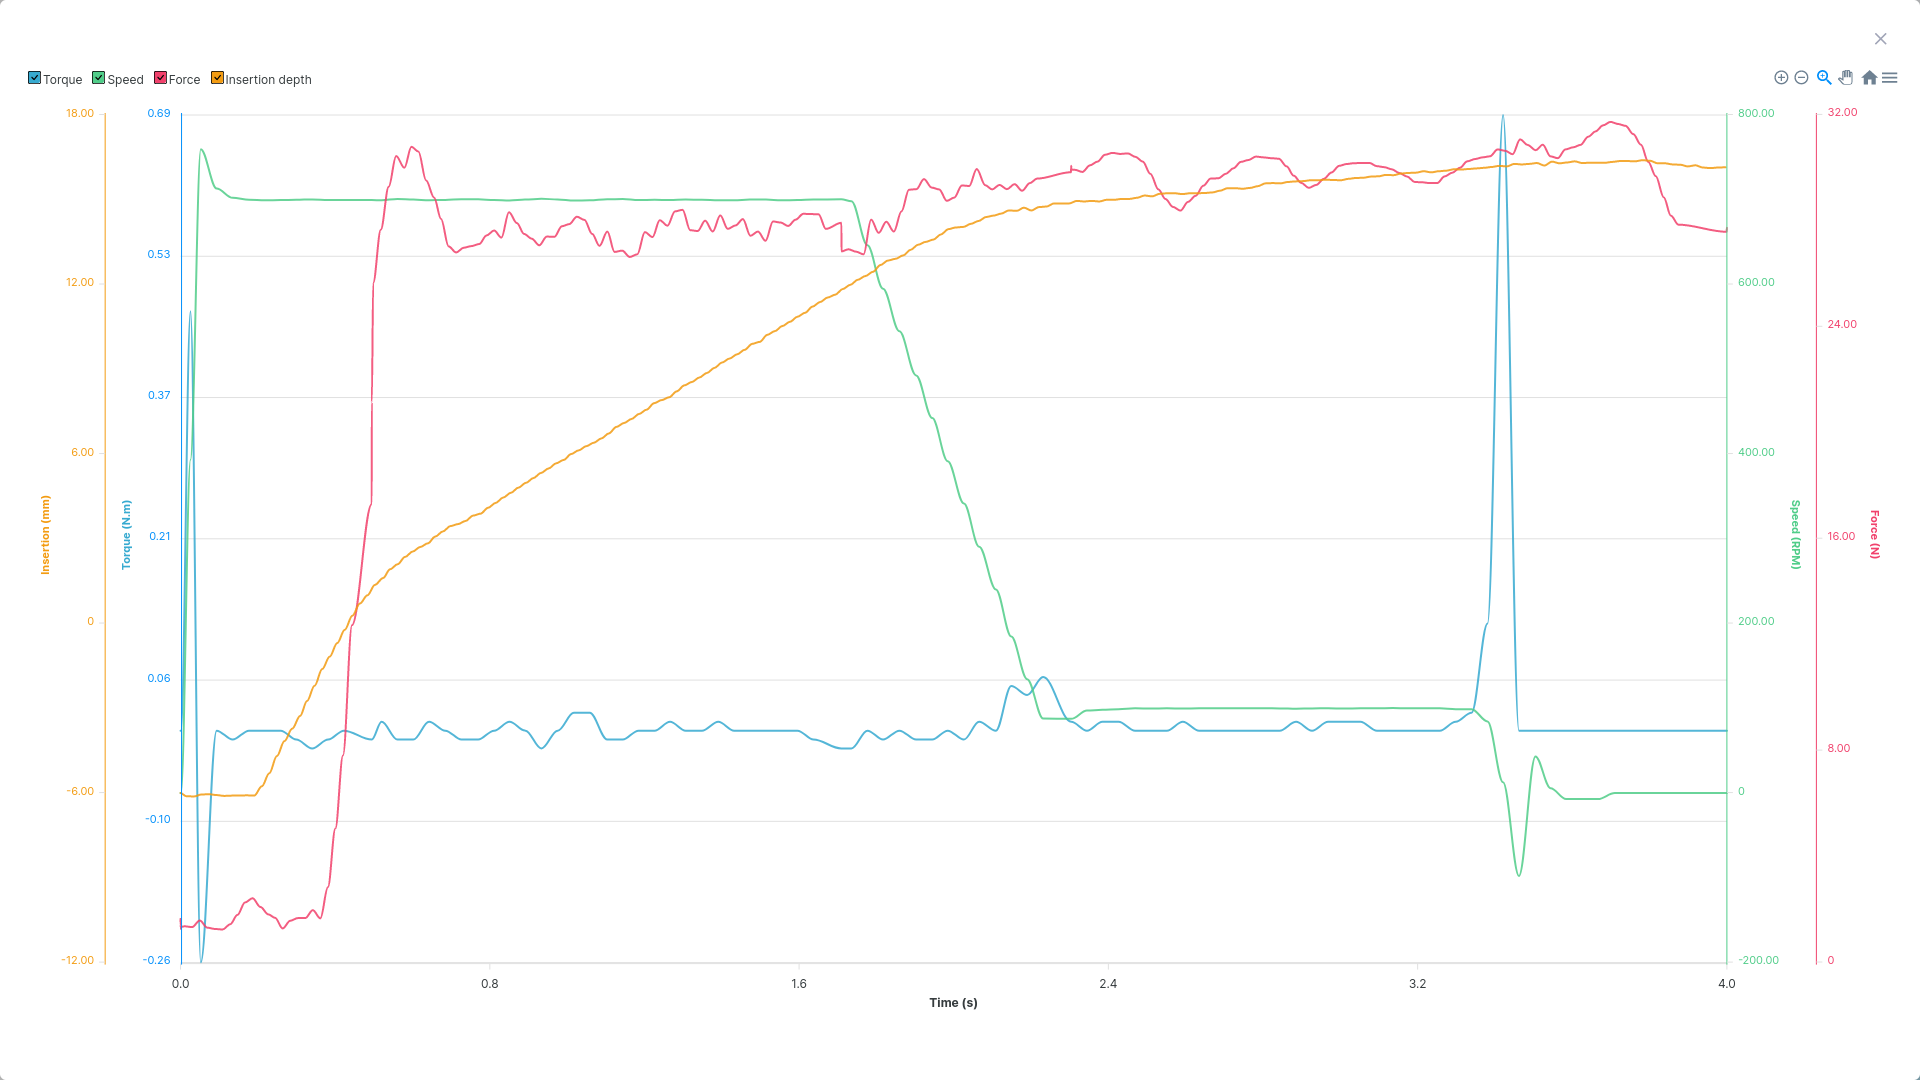
The data graph can be expanded to full screen by clicking the expand button in the top right corner of the graph. It is also interactive, by clicking the trace names you can hide and show individual traces, you can zoom in and out with the buttons or select a specific area to zoom in on by clicking and dragging on the graph.